Building a custom dashboard to meet your needs usually meant one of two things:
- Buying software that can do it for you, but with a high learning curve for users
- Or using an off-the-shelf app like Excel or Google Sheets to build it – Lower entry barrier, but still lots of things to figure out
Now with AI, there is a third way. It can all start with a prompt describing the dashboard you need.
A simple Example
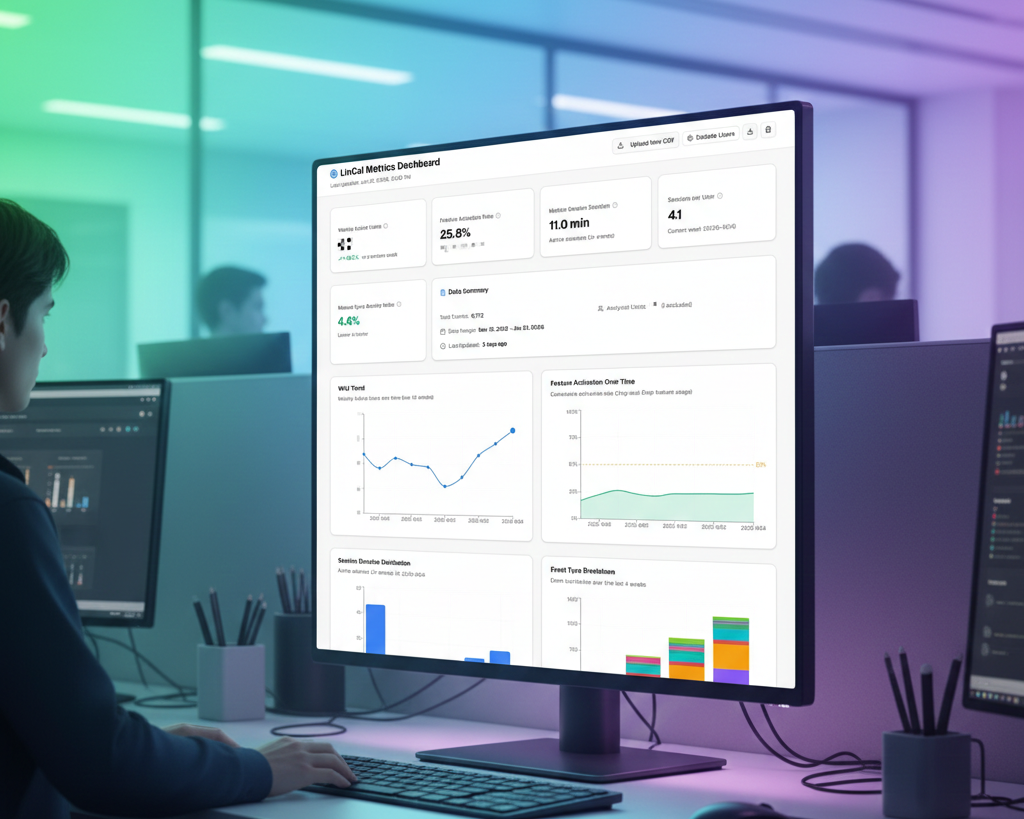
We created a web app called LinCal, which is a calendar app for Linear. With it, you can visualize work on a calendar grid, drag and drop, and more.
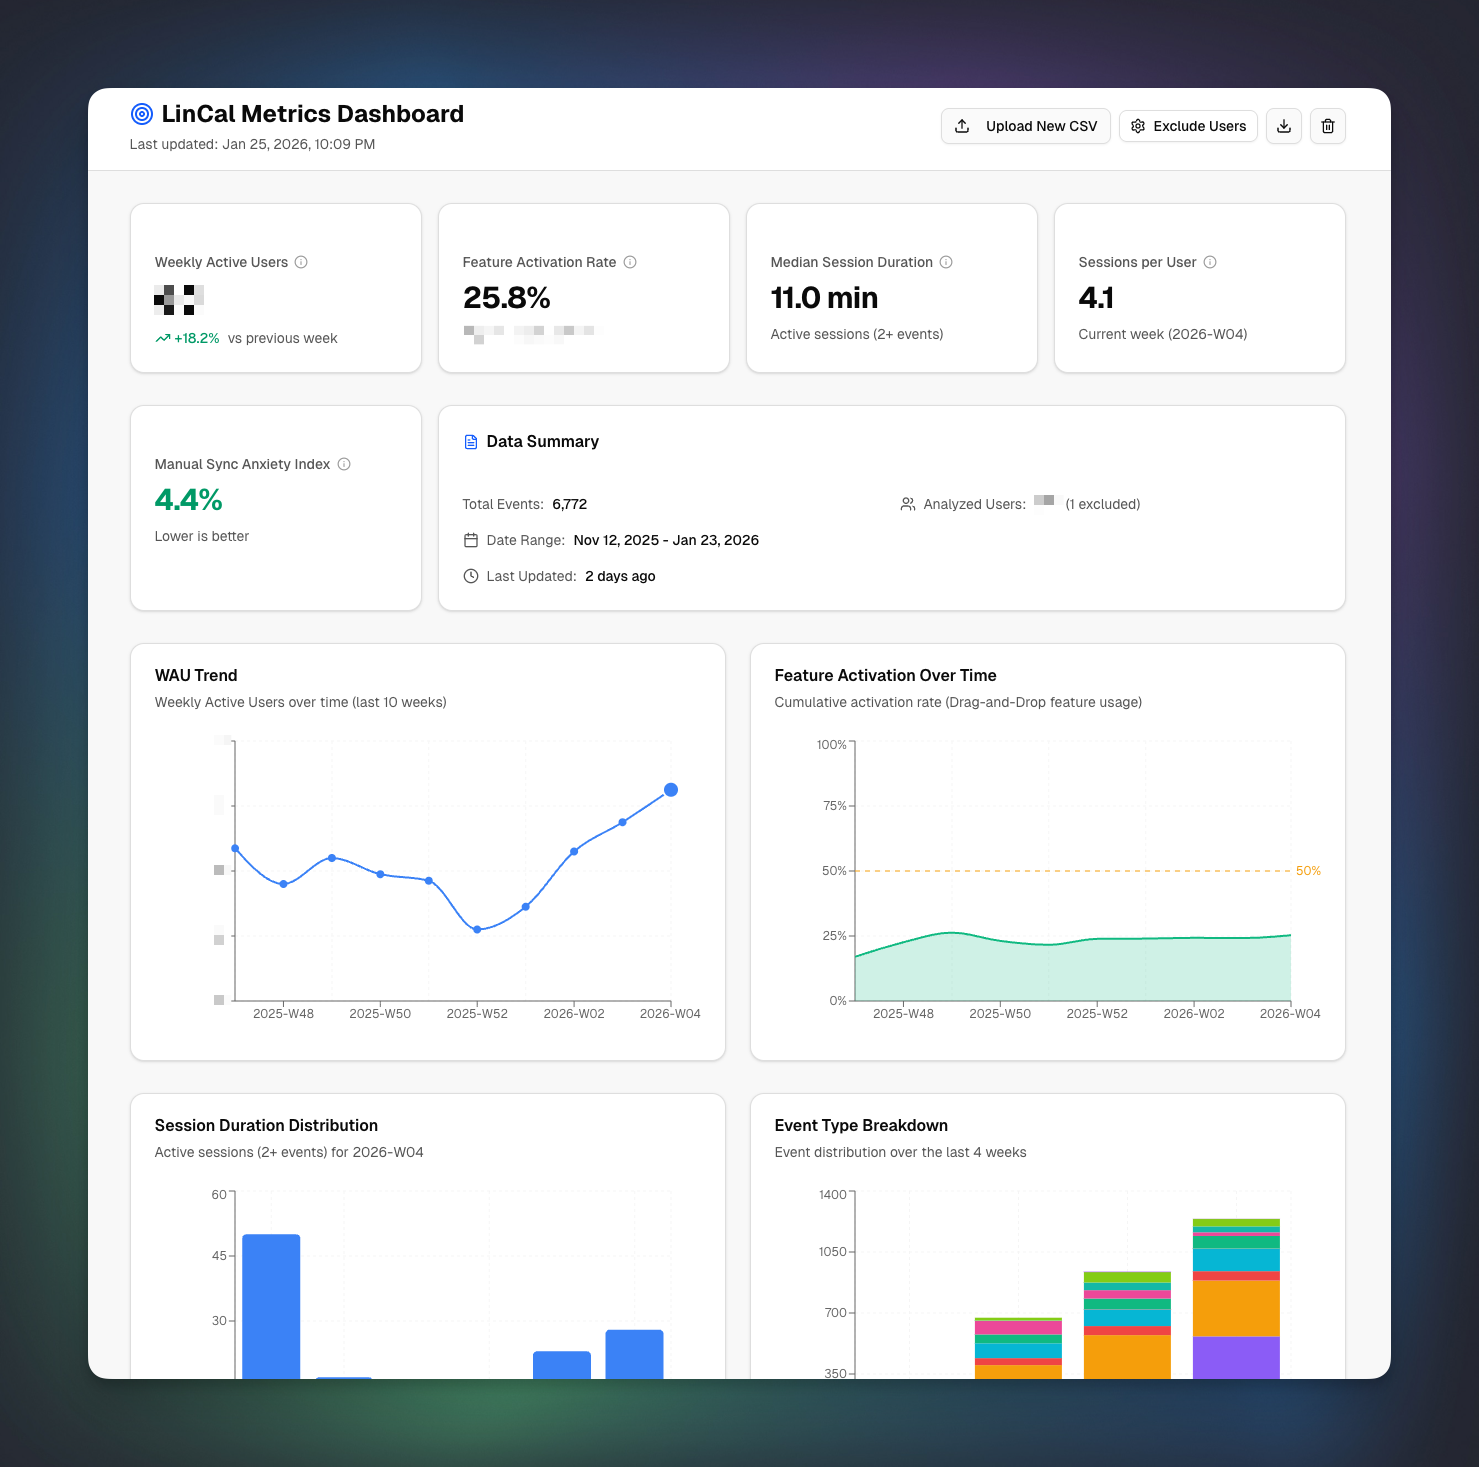
To analyze how users are using the product, whether they come back, how often, and which actions they take, we wanted a simple SaaS dashboard showing the key metrics in graphs and tables.
And here is how we created it.
Chosing the Right Tool
First, there are *lots* of AI tools out there you could use for this task. We decided to go with v0 by Vercel, but Google AI Studio or simply an AI chat assistant could also work.
The data we wanted to visualize was available in a CSV file. For version 1, we do not need real-time data, since only a few people will view it once a week.
Technical requirements for v1 of the dashboard:
- No login required
- Runs in the browser local cache. That means another user finding the app online won’t see any data without having the CSV file
- Accessible via public URL, so everyone on the team can use it
Defining the metrics
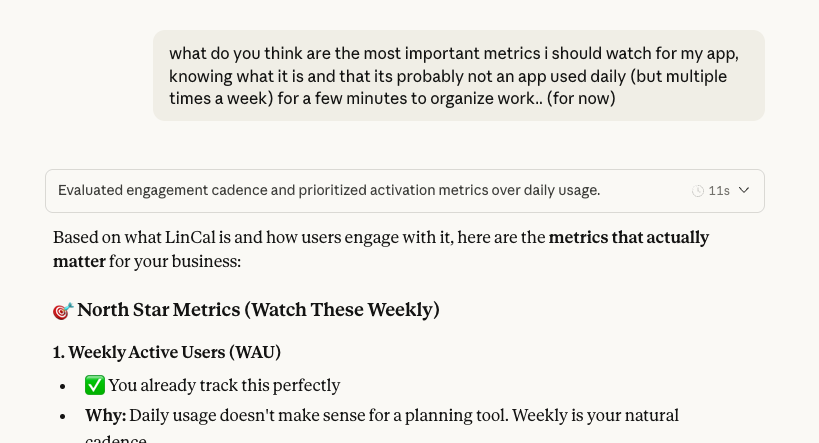
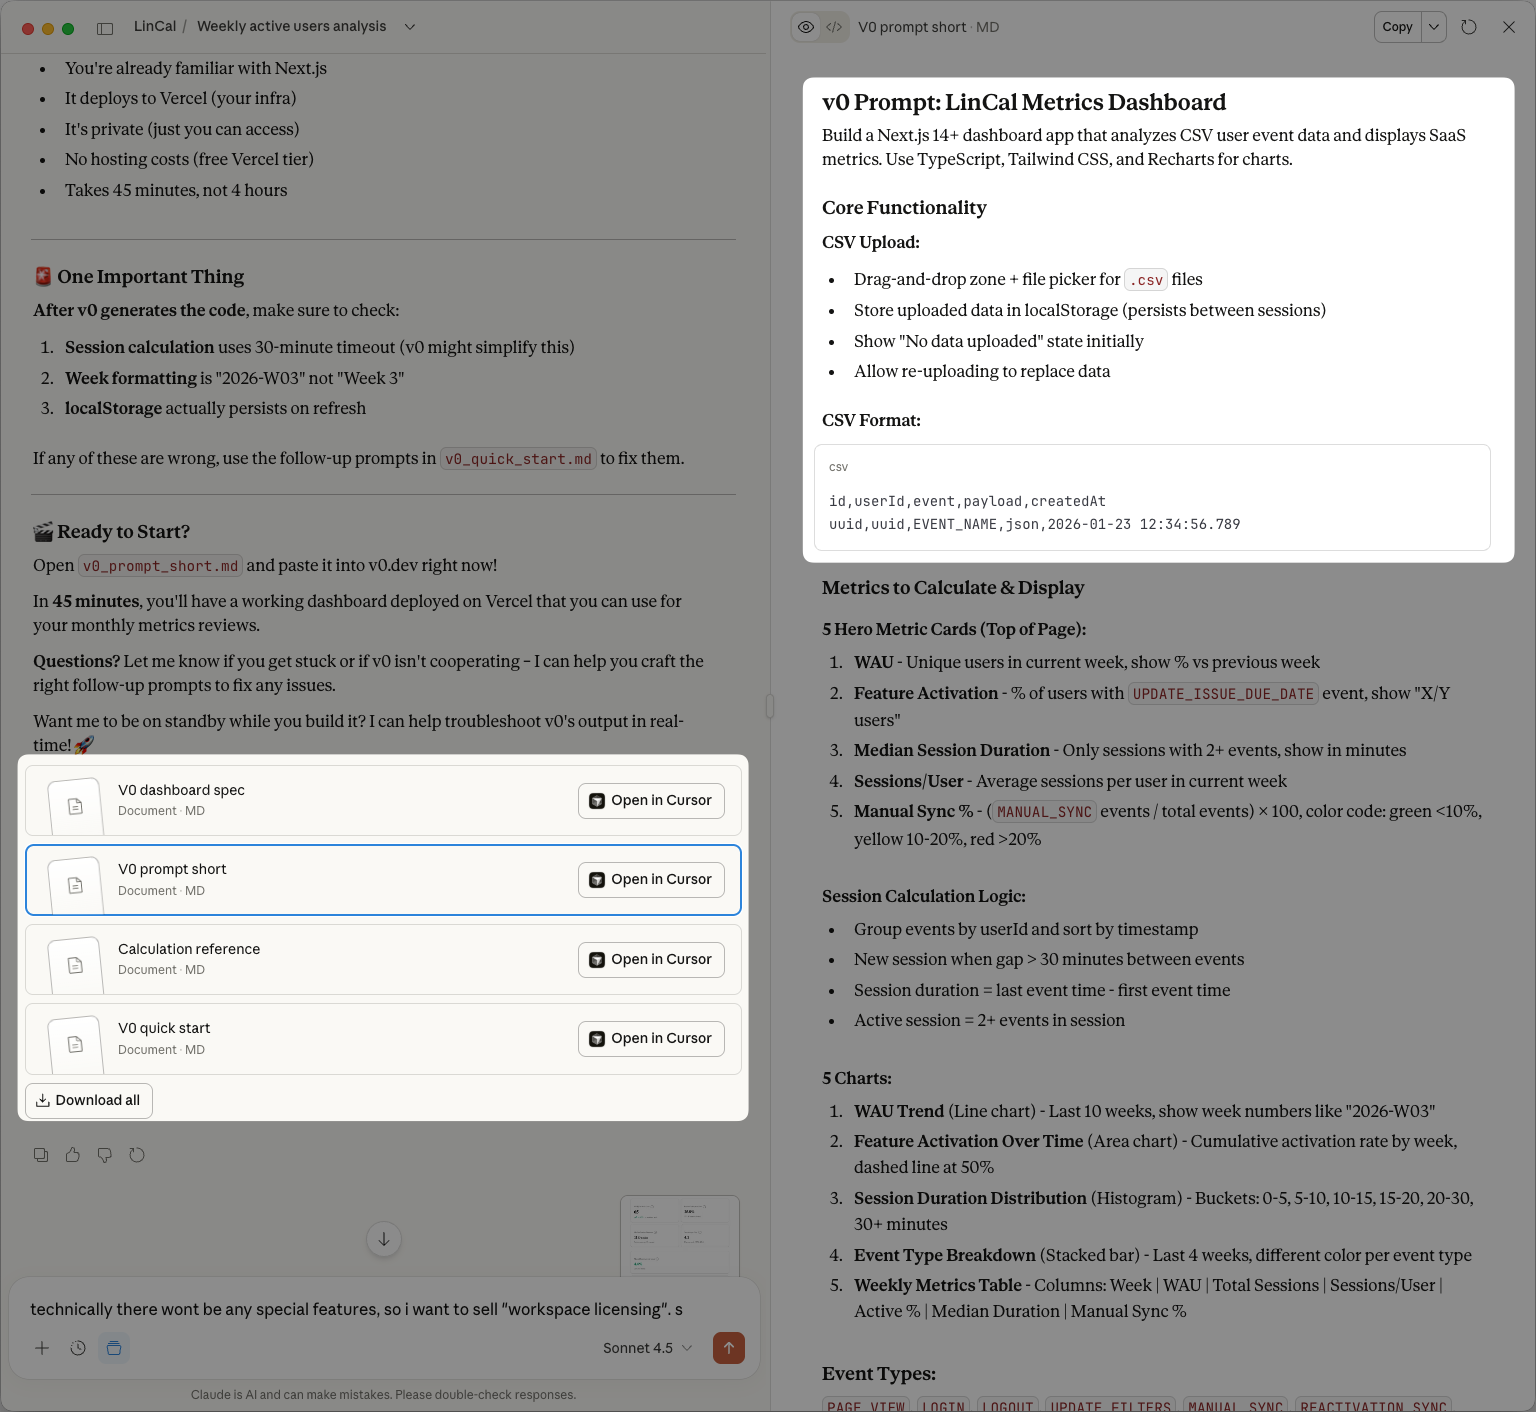
But before building the dashboard, we spent time analyzing which metrics are most important for our product; not everything in the CSV is equally important. An important metric for us, for example, is WAUs (weekly active users), and median time active in the app. These are two example metrics we defined.
Once we defined the technical requirements and data to show/calculate, we used Claude to build us a prompt for creating the app. (Claude offered to build the dashboard right away, but we wanted to use the built-in features in Vercel to publish the app right away, without any additional service in between.)
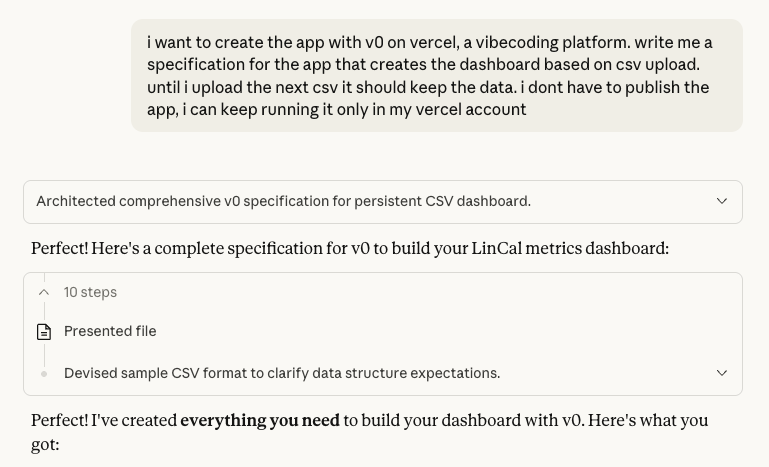
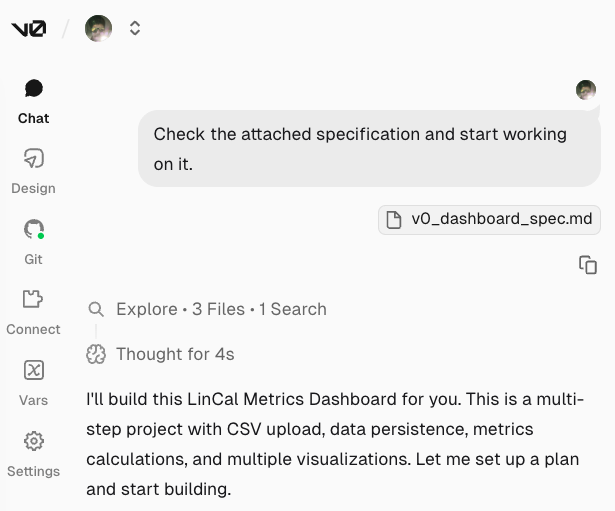
Building with v0
The prompt was pasted into v0 and, along with the CSV attachment, and executed.
Minutes later, version 1 of the dashboard was live. With 3 additional prompts, we fixed a bug and added tooltips for showing the calculations behind the metrics.
As a final check, we asked Claude to review the calculations again to confirm they were correct.
After 30 minutes of work we had our custom SaaS dashboard live.
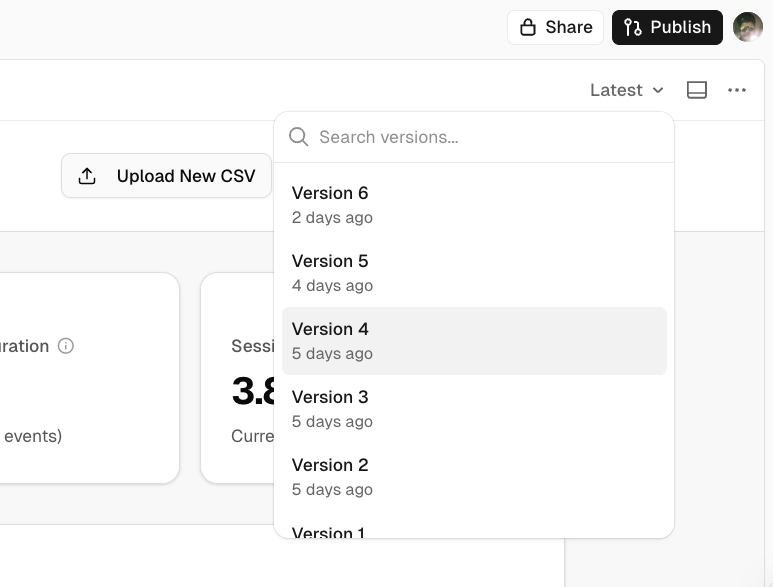
Easy to Maintain
It’s also easy to keep updated, its connected to its own GitHub repo, so we have versioning of the dashboard app. We can do rollbacks in case something happens. The next step for later in the year is to connect it directly to the database and bypass the needed CSV upload, and when we do that step we will add an extra layer of security by requiring a login from specific Google accounts.
Conclusion
The cumbersome task of learning how to visualize data, calculate metrics, and put it all together in a neatly organized dashboard – that can be done today with one central interface – an AI assistant/vibecoding tool.
This is again a simple example of how AI is changing the reach of generalists.
If you want to deploy such knowledge in your team, explore our AI services. We help teams, companies, and professionals level up their skills and become more productive through a sensitive application of AI.